Matlab Sandbox
Published:
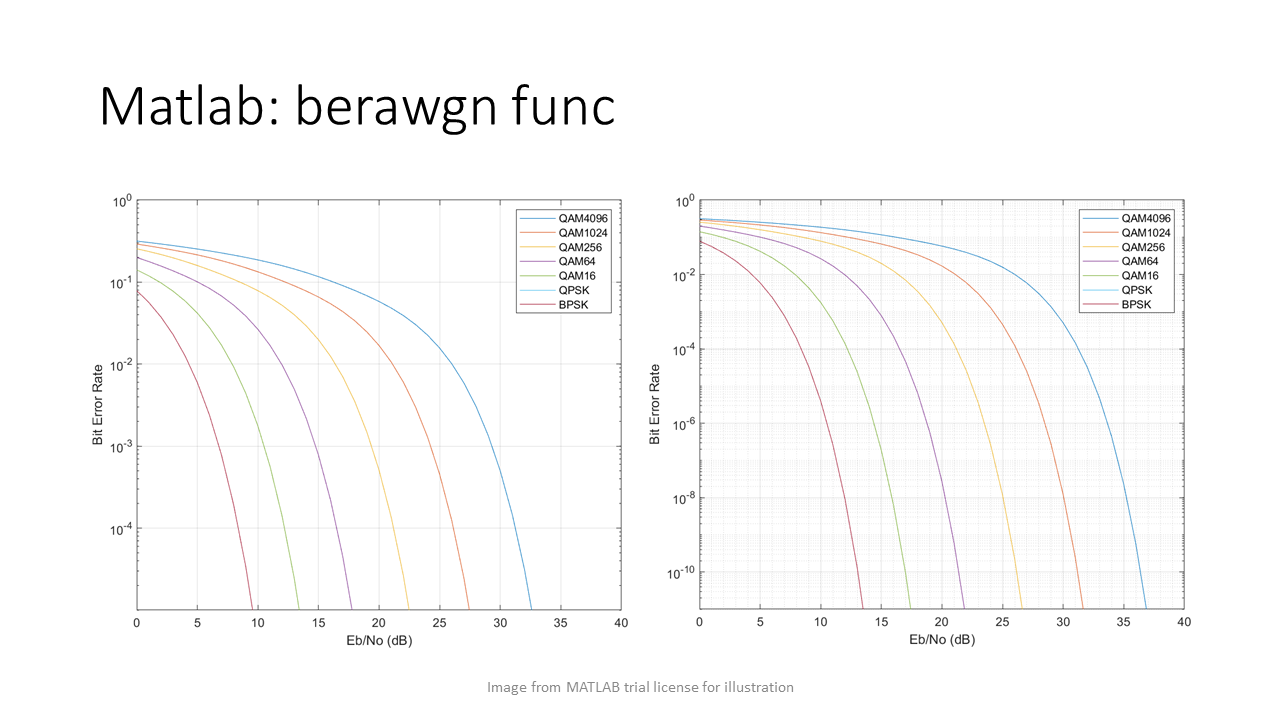
This is a sandbox example of Matlab. From below picture, we can see the Rx demodulation threshold at certain BER ratio for special modulation scheme. And in theory, BPSK and QPSK curves are identical in terms of BER vs. EB/N0
Vector Sum Illustration: e^(j2pi1)*
 Euler’s formula: 𝑒^(𝑗ω𝑡) = cos(ωt) + jsin(ωt)
Impendence matching on smith chart
There is a typo in above animation. I hope you can capture it.


